Katerini Tunnel T4
Automation in the Service of Safety
At a glance:
- AS Analytics brings together data from PLC, SCADA, ERP and quality control systems on a single platform.
- It covers the entire production process (processing, CIP and transfers), not only packaging.
- It enables true batch traceability and helps prevent deviations in real time.
- It tracks equipment utilisation at every stage of production.
A modern plant can generate thousands of data points every minute and still take hours to answer a simple question:
Why has line performance dropped?
The problem is usually not a lack of information. It is that the information is fragmented:
When a performance deviation, a quality failure or an issue with a specific batch arises, the production manager must gather evidence from multiple sources. By the time the full picture is available, production has already moved on and the decision is delayed.
AS Analytics, AS Hellas’ industrial analytics platform, was designed to close precisely this gap: to bring production data together, turn it into clear KPIs and help teams identify early where time, performance and product are being lost.
In a food and beverage plant, different systems record different aspects of the same production process.
The production PLC/SCADA system records every stage of product processing, including recipes, parameters, sensor readings and timings. The CIP system keeps corresponding data for cleaning cycles. The ERP system manages batches, materials and inventory, while quality control results are recorded in separate forms.
Most tools on the market focus on the final stage of the line – packaging or bottling – and primarily measure equipment speed and downtime. This provides an initial view, but leaves out the upstream processing stages, where the greatest improvement potential often lies.
All this information is useful. But when it remains isolated, it does not provide a complete operational picture.
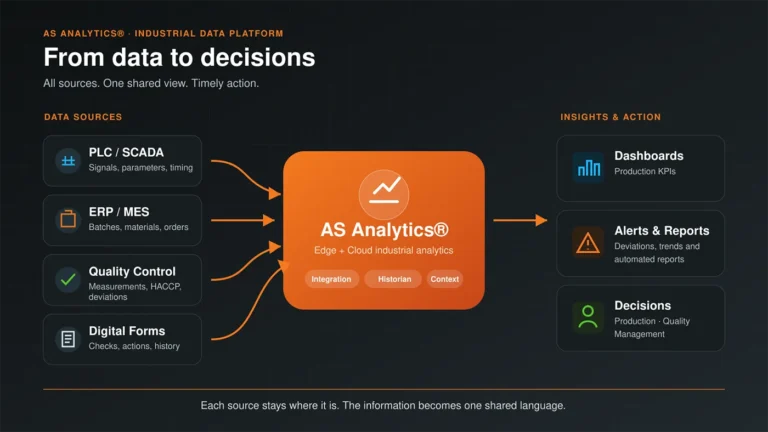
AS Analytics addresses this fragmentation by connecting data from every production and processing stage – not only final packaging – in a single environment. Each data source remains where it is; the platform reads it and consolidates it into one coherent view.
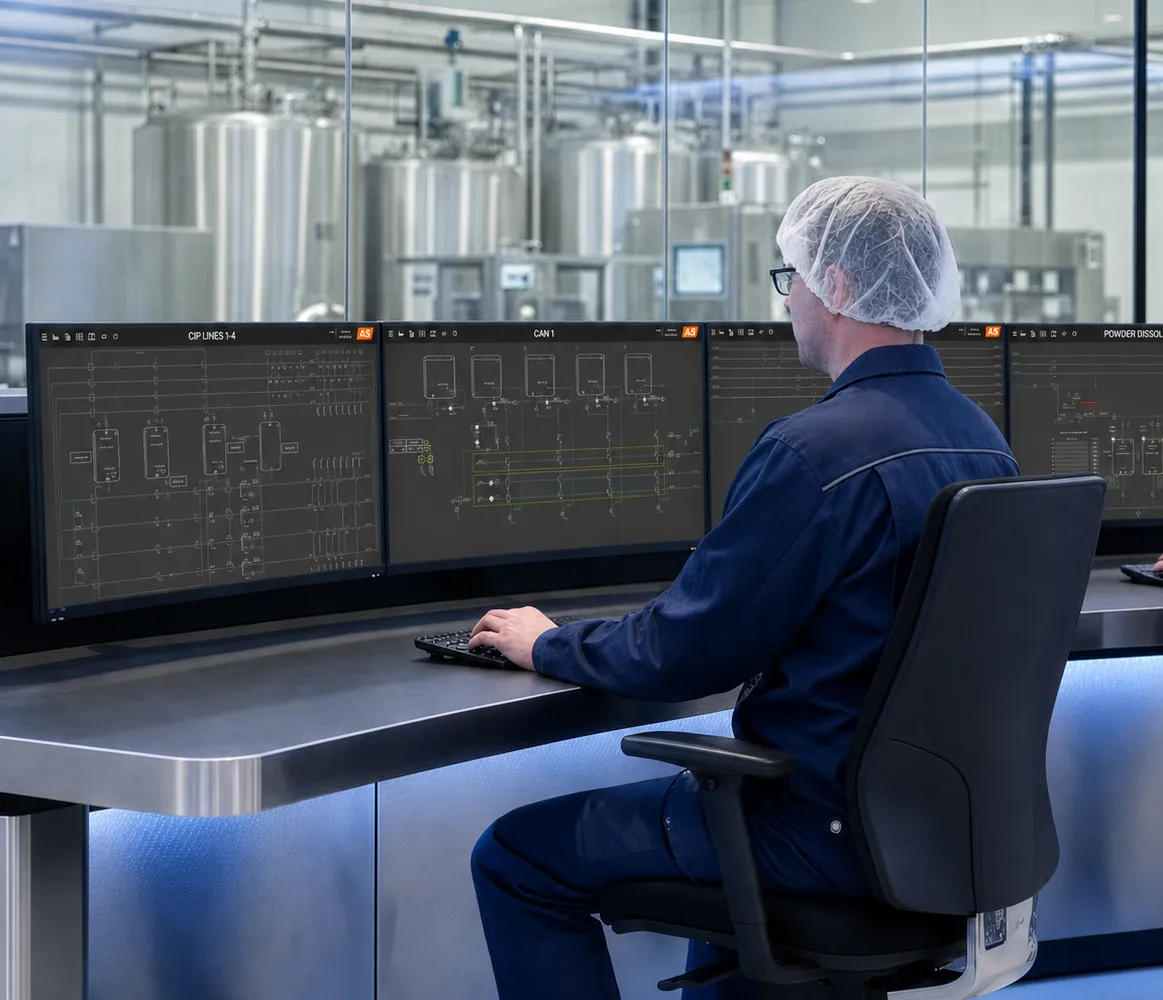
For example, in a soft-drink or bottled-water plant, a production manager can see on the same screen:
The value lies not only in displaying data on a dashboard. It lies in giving the data a common language so it can directly inform decisions.
OEE (Overall Equipment Effectiveness) is widely used to assess the effectiveness of a process stage or item of equipment based on availability, performance and product quality. It is a useful but partial metric: it typically measures one point on the line – often the final packaging stage – rather than the product’s entire journey.
A low OEE indicates that a stage is not using its full capacity, but it does not explain why. The root cause becomes visible when OEE is combined with data from upstream processing stages: recipe execution time, the availability of tanks and feed lines, product transfer time between stages and product losses during processing.
When OEE is placed in this broader context and calculated in real time, it stops being a backward-looking figure and becomes the starting point for targeted action across the entire production process – not only its final stage.
A comprehensive industrial analytics system does more than display measurements. It turns raw signals and records into indicators that can be assessed and acted upon.
Examples include:
The value of these indicators lies not in recording them, but in the questions they can answer:
When the answers are immediately available, decision-making shifts from intuition to evidence.
In the food and beverage industry, traceability is more than an operational convenience. It is a fundamental requirement for quality control and the effective management of deviations (ISO 22000, HACCP).
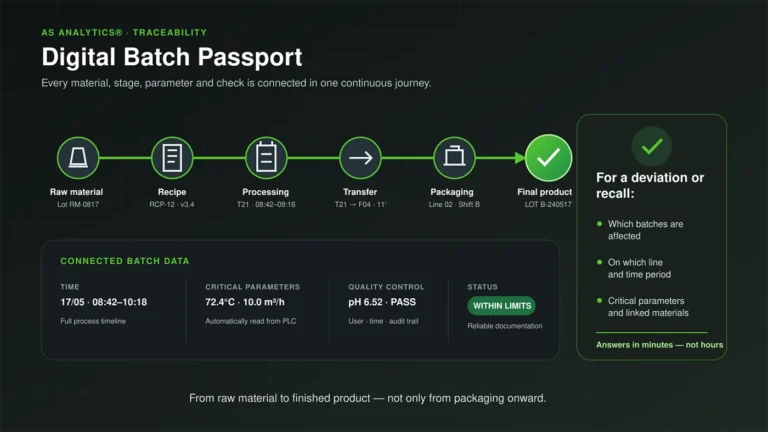
This is also where monitoring every production stage makes the greatest difference: only when data from each stage is connected can a batch truly be traced from raw material to finished product – rather than only from the point at which it reaches packaging.
AS Analytics can connect production data with digital forms and batch information, creating a coherent journey from raw material to finished product.
In the event of a deviation or recall, the team can quickly identify:
Immediate access to this information reduces investigation time and limits the risk of human error.
The real value of analytics emerges when information leads to timely action.
AS Analytics allows rules, thresholds and alerts to be defined for critical parameters. When a measurement deviates from the target range, the team is notified before the issue has a significant impact on production.
For example, the platform can detect:
This means the business is not limited to documenting what has already happened. It can intervene while the issue is still manageable.
AS Analytics is not simply another Business Intelligence tool, nor is it a system that measures only the performance of the final packaging line. It was designed to cover the entire production and processing journey, from raw material to finished product. This includes:
Most importantly, it is implemented by a team that understands not only data, but also production processes, automation and the real operating conditions of a food and beverage plant.
This knowledge enables the platform to cover the entire production chain – not only the point at which the product is counted in units – and turn this end-to-end view into actionable operational intelligence.
The move to industrial analytics does not need to begin with a large, complex project.
The first step is to identify the areas where a lack of information creates the greatest operational cost:
Tracking the right KPIs over a defined period usually reveals two or three areas with clear room for improvement. These can become the starting point for a targeted, measurable implementation.
Industry does not simply need more data. It needs data to be better connected, interpreted and used.
The value lies not in how much data a plant records, but in how quickly it can answer critical questions and turn information into action.
AS Hellas has deployed AS Analytics in liquid food and soft-drink plants, tailoring the platform to the needs, processes and priorities of each site.
Would you like to see how AS Analytics can be applied to your production operations? Request a tailored presentation/demo from the AS Hellas team at sales@ashellas.com.